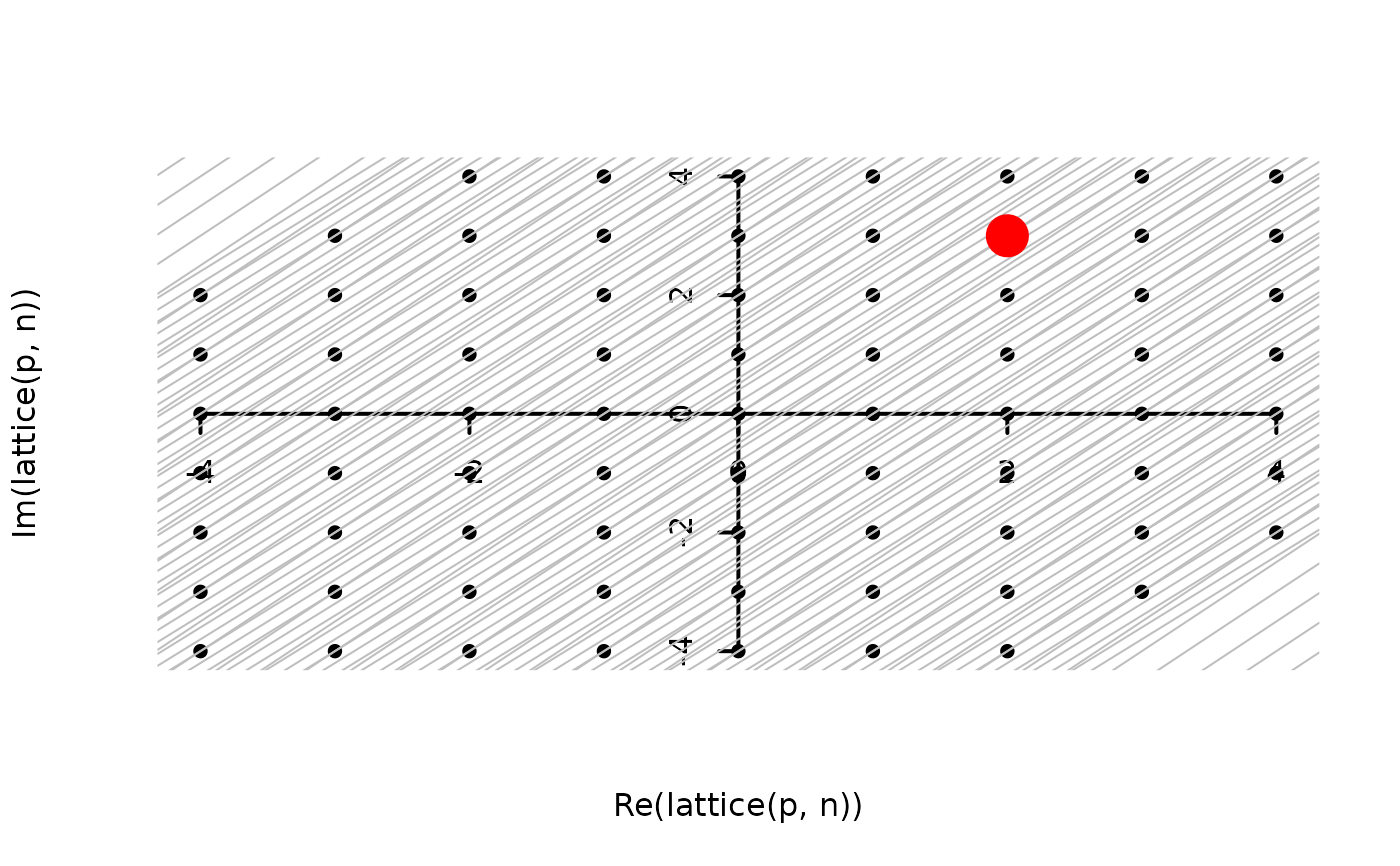
Plots a lattice of periods on the complex plane
latplot.RdGiven a pair of basic periods, plots a lattice of periods on the complex plane
latplot(p, n=10, do.lines=TRUE, ...)Arguments
- p
Vector of length two with first element the first period and second element the second period. Note that \(p_1=2\omega_1\)
- n
Size of lattice
- do.lines
Boolean with default
TRUEmeaning to show boundaries between adjacent period parallelograms- ...
Extra arguments passed to
plot(). See examples section for working use
References
K. Chandrasekharan 1985. Elliptic functions, Springer-Verlag.