Ecosystem diagnostics for output of untb()
species.count.RdProvides ecosystem diagnostics of species count datasets (species
counts and species tables), useful for the output of untb()
Details
These functions takes a matrix argument, which is interpreted as the
output of untb(...,keep=TRUE).
Function species.count() returns the total number of species
present in each row (ie at each timestep).
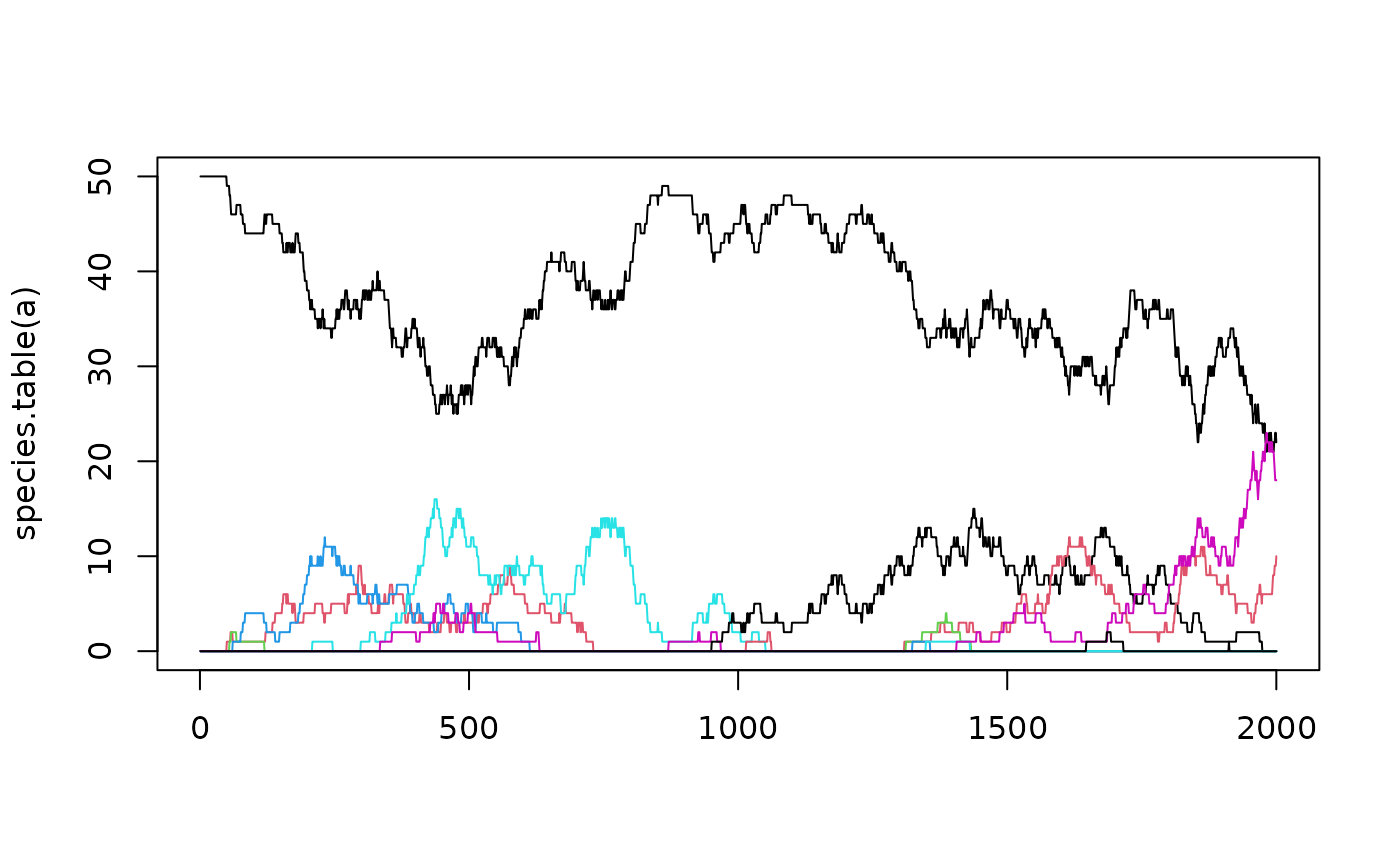
Function species.table() returns a matrix \(M\) where
M[i,j] column of the matrix is the abundance of species \(j\)
at time i.
Examples
a <- untb(start=rep(1,50), prob=0.01, gens=2000, keep=TRUE)

plot(species.count(a),type="b")

matplot(species.table(a),type="l",lty=1)


jj <- a[2000,]
print(jj)
#>  [1]  1  1 12 12 12 12  1  1 12  1  1  8 12  1 12  1 12  1  1 12  8 12 12  1  1
#> [26]  1  1 12 12  8  1  1  1  1  8  1 12  1 12  8  8  1  8 12  1  8  8  1  8  8
as.count(jj)
#>  1 12  8
#> 23 16 11
jj <- a[2000,]
print(jj)
#> [1] 1 1 12 12 12 12 1 1 12 1 1 8 12 1 12 1 12 1 1 12 8 12 12 1 1
#> [26] 1 1 12 12 8 1 1 1 1 8 1 12 1 12 8 8 1 8 12 1 8 8 1 8 8
as.count(jj)
#> 1 12 8
#> 23 16 11