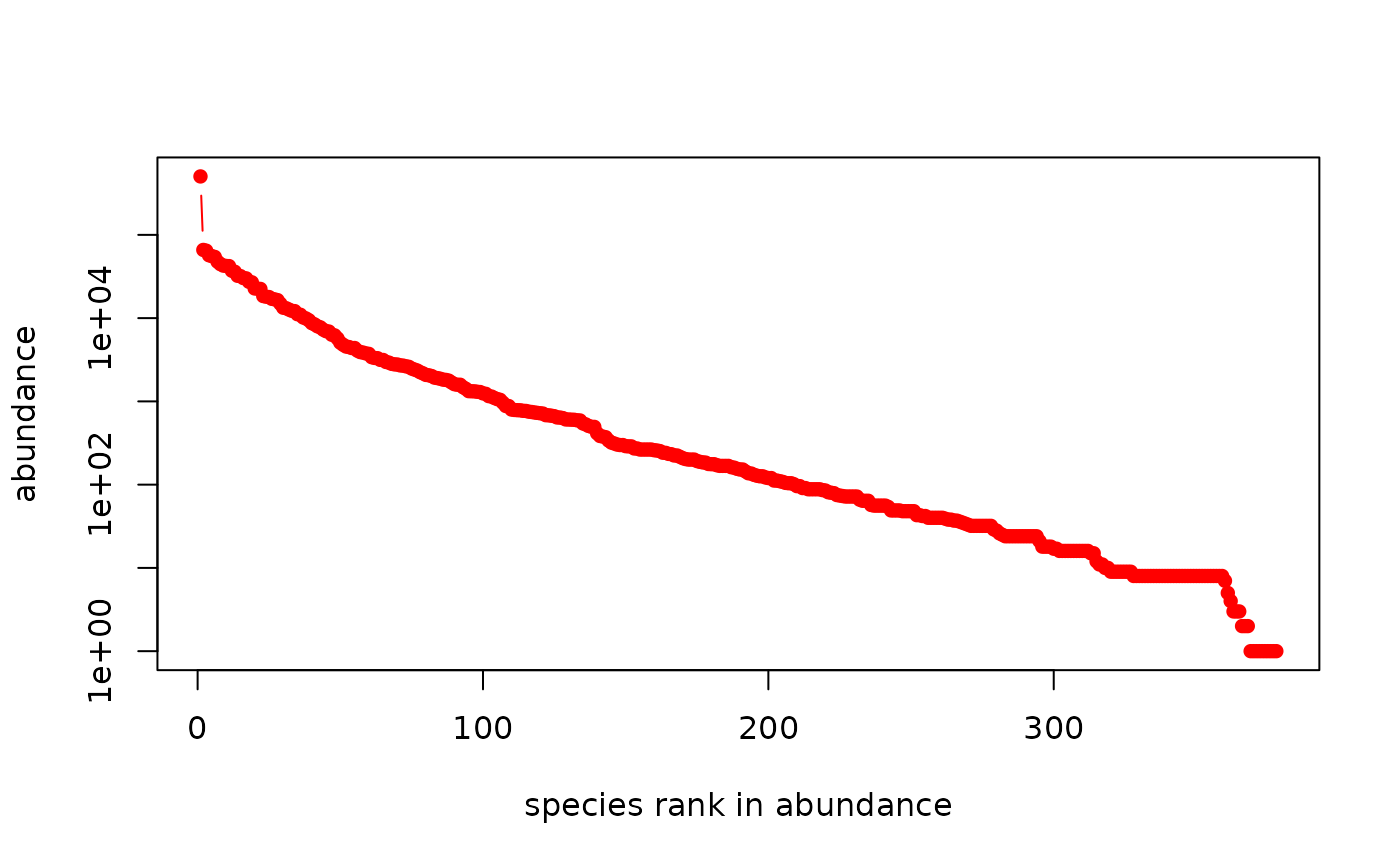
Abundance curves
plot.count.RdPlot the ranked abundance curve
Arguments
- x
Ecosystem object, coerced to class count
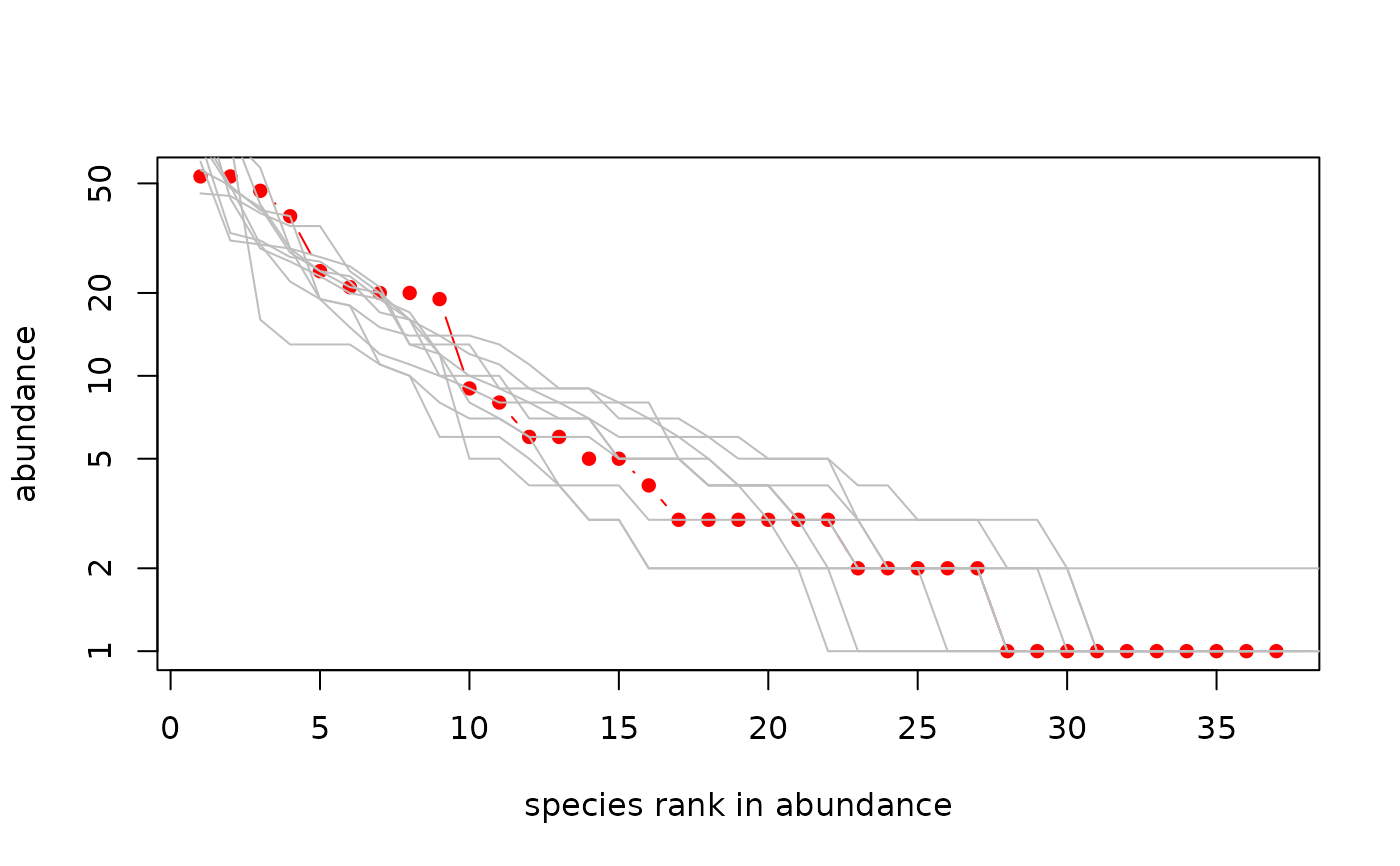
- uncertainty
Boolean, with
TRUEmeaning to show bootstrapped estimates for the species diversity curve, and defaultFALSEmeaning to omit this- expectation
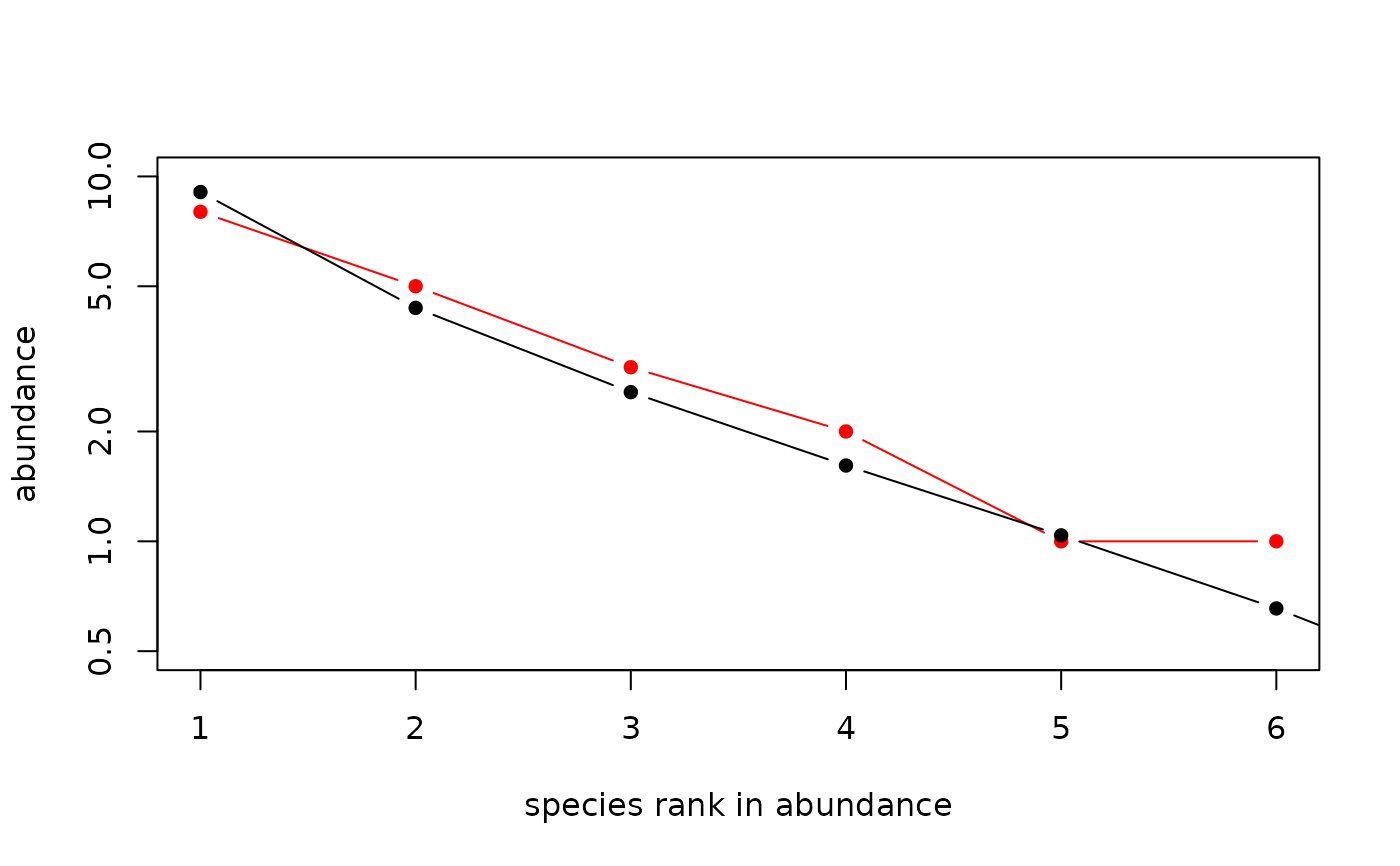
Boolean, with
TRUEmeaning to plot expected abundances, and defaultFALSEmeaning not to plot them. Warning this option takes a loooong time to run, even for moderate values of \(J\)- theta
Fundamental biodiversity number used if argument
uncertaintyorexpectationareTRUE. Default value ofNULLmeans to use the maximum likelihood estimate returned by functionoptimal.theta()- n
Number of bootstrapped estimates to plot
- ...
Extra parameters passed to
untb()